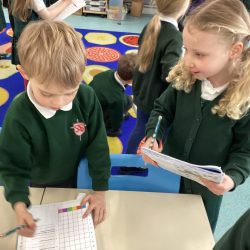
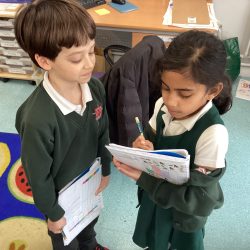
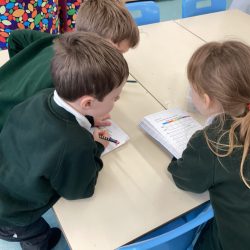
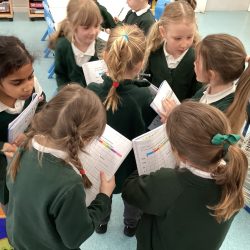
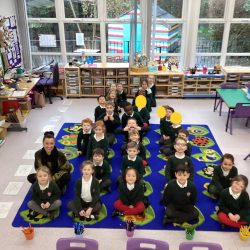
This week in Maths, Year 1 have been learning all about collecting data. They have become researchers and have been conducting and interpreting their own data. We have learnt about pictographs, bar models and tally charts. On Tuesday, we stood by the school gate and collected data about the colour of cars that are in the local area. We found that white, silver and black were the most popular! We didn’t spot any pink or orange!! On Friday, we conducted our own research by asking the favourite colour of our peers. First, we recorded a tally chart, and then put that data into a bar model, before drawing conclusions on the results we found.
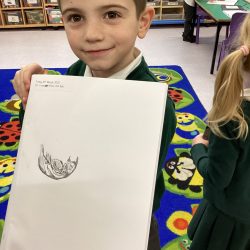
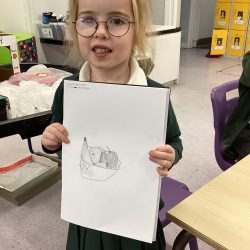
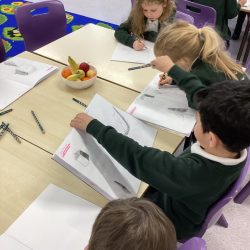
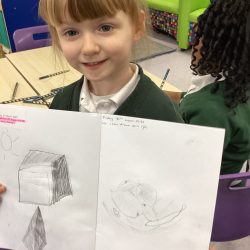
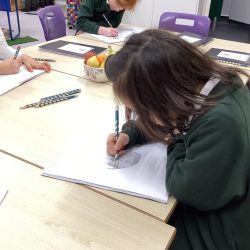
In Art, we have been furthering out sketching skills by doing some still life drawing. We learnt about how shadows and shade are created, depending on the direction of the sunlight. We each did a still life drawing of a fruit bowl, paying attention to the shapes, shades and shadows.

